When your project grows, the codebase grows and your test suite too. The more the test you write, the longer the execution is. And then, the Allowed memory size exhausted error occurred in your CI. To solve this issue quickly, you bump PHP allocated memory. But it doesn’t fix the problem, and this cycle goes on for a while. Until you hit critical thresholds.
Fixing memory issues is really difficult, and there are not many tools to help. We need to retrieve information about our test executions. Monitoring a production application is a known good practice. So why this is not applied to our test code?
The OpenTelemetry emerged those years. It could be useful to use it in our context to produce traces and metrics about our test suite.
I’ve recently discovered the flow-php/phpunit-telemetry-bridge library. It brings observability to our PHPUnit tests using OpenTelemetry. The library consists of a PHPUnit extension that collects some data and sends them to any OTLP-compatible backend.
Start using it by installing the component using Composer:
composer require --dev flow-php/phpunit-telemetry-bridgeThen add the telemetry configuration into PHPUnit:
<?xml version="1.0" encoding="UTF-8"?>
<phpunit>
<!-- ... -->
<extensions>
<bootstrap class="Flow\Bridge\PHPUnit\Telemetry\TelemetryExtension">
<parameter name="service_name" value="phpunit-opentelemetry"/>
<parameter name="transport" value="curl"/>
<parameter name="endpoint" value="http://localhost:4318"/>
<parameter name="emit_traces" value="true"/>
<parameter name="emit_metrics" value="true"/>
<parameter name="emit_test_spans" value="true"/>
<parameter name="emit_test_case_spans" value="true"/>
<parameter name="curl_connect_timeout_ms" value="1000"/>
<parameter name="curl_timeout_ms" value="2000"/>
</bootstrap>
</extensions>
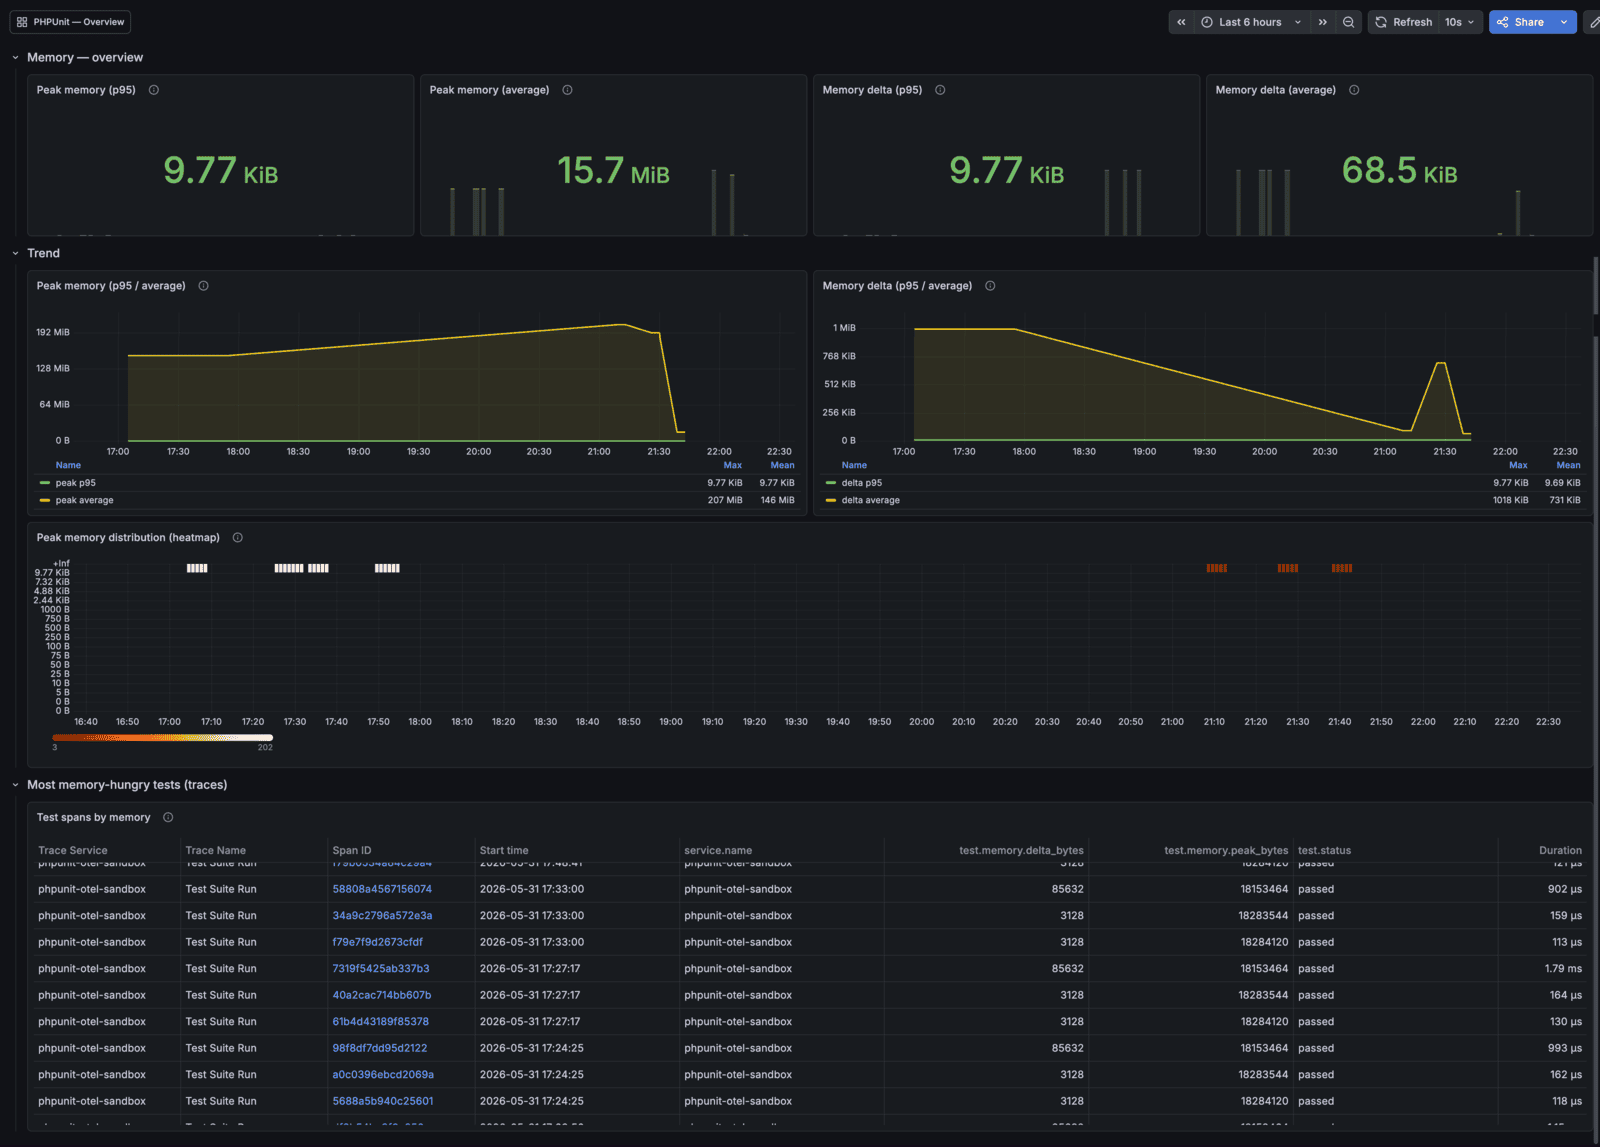
</phpunit>After that, every time your tests are run, the library will send the telemetry backend. Then you can create some dashboards to visualize the data:
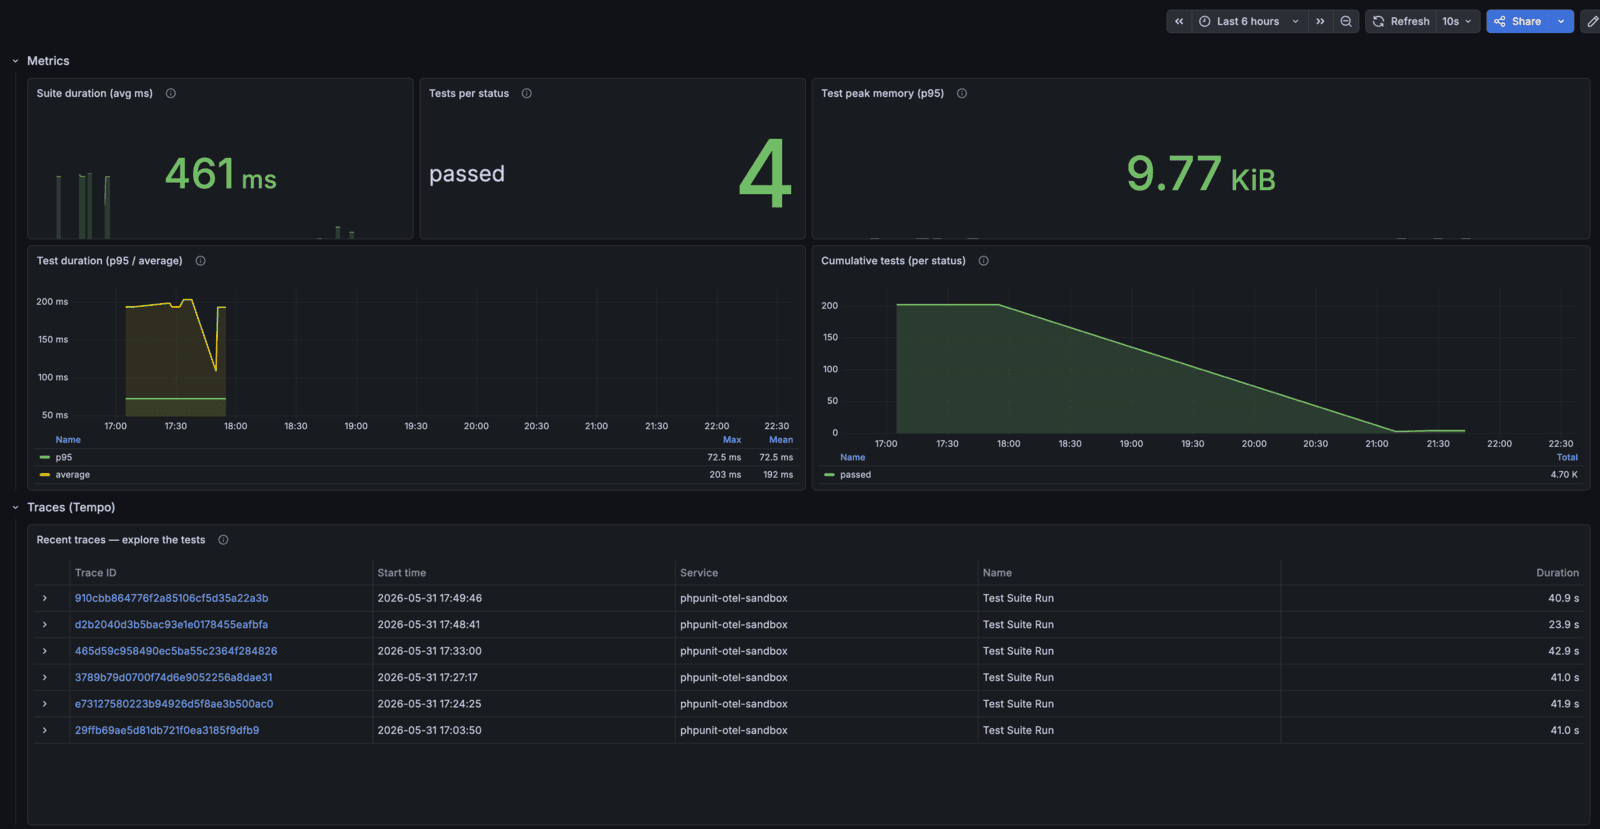
Data contains execution details like duration, memory consumption, executed tests, etc.
When using observability in your stack, don’t forget that instrumenting every test can be expensive. Use it when you really need it.
Want to get more information? Check out the PHPUnit Telemetry bridge documentation.